Field Mapping Method
Unlike many landscape analyses, field mapping for this study area did not occur directly in the field. Instead, it took place behind a desk, using the panoramic photo viewer to map the landscape-defining elements for all four themes.
Before the field mapping could be performed, however, a second visit to the study area was needed. This trip took place on March 14, another cold, overcast day with temperatures hovering around 2 degrees. This time, more than 1,000 pictures were taken, of which 384 were selected for inclusion in the interactive viewer.
A four-hour, 20 km walk through the study area provided all the imagery needed to cover the full study area. Notes were taken on aspects of the landscape that cannot be captured in images, such as various sounds and smells.
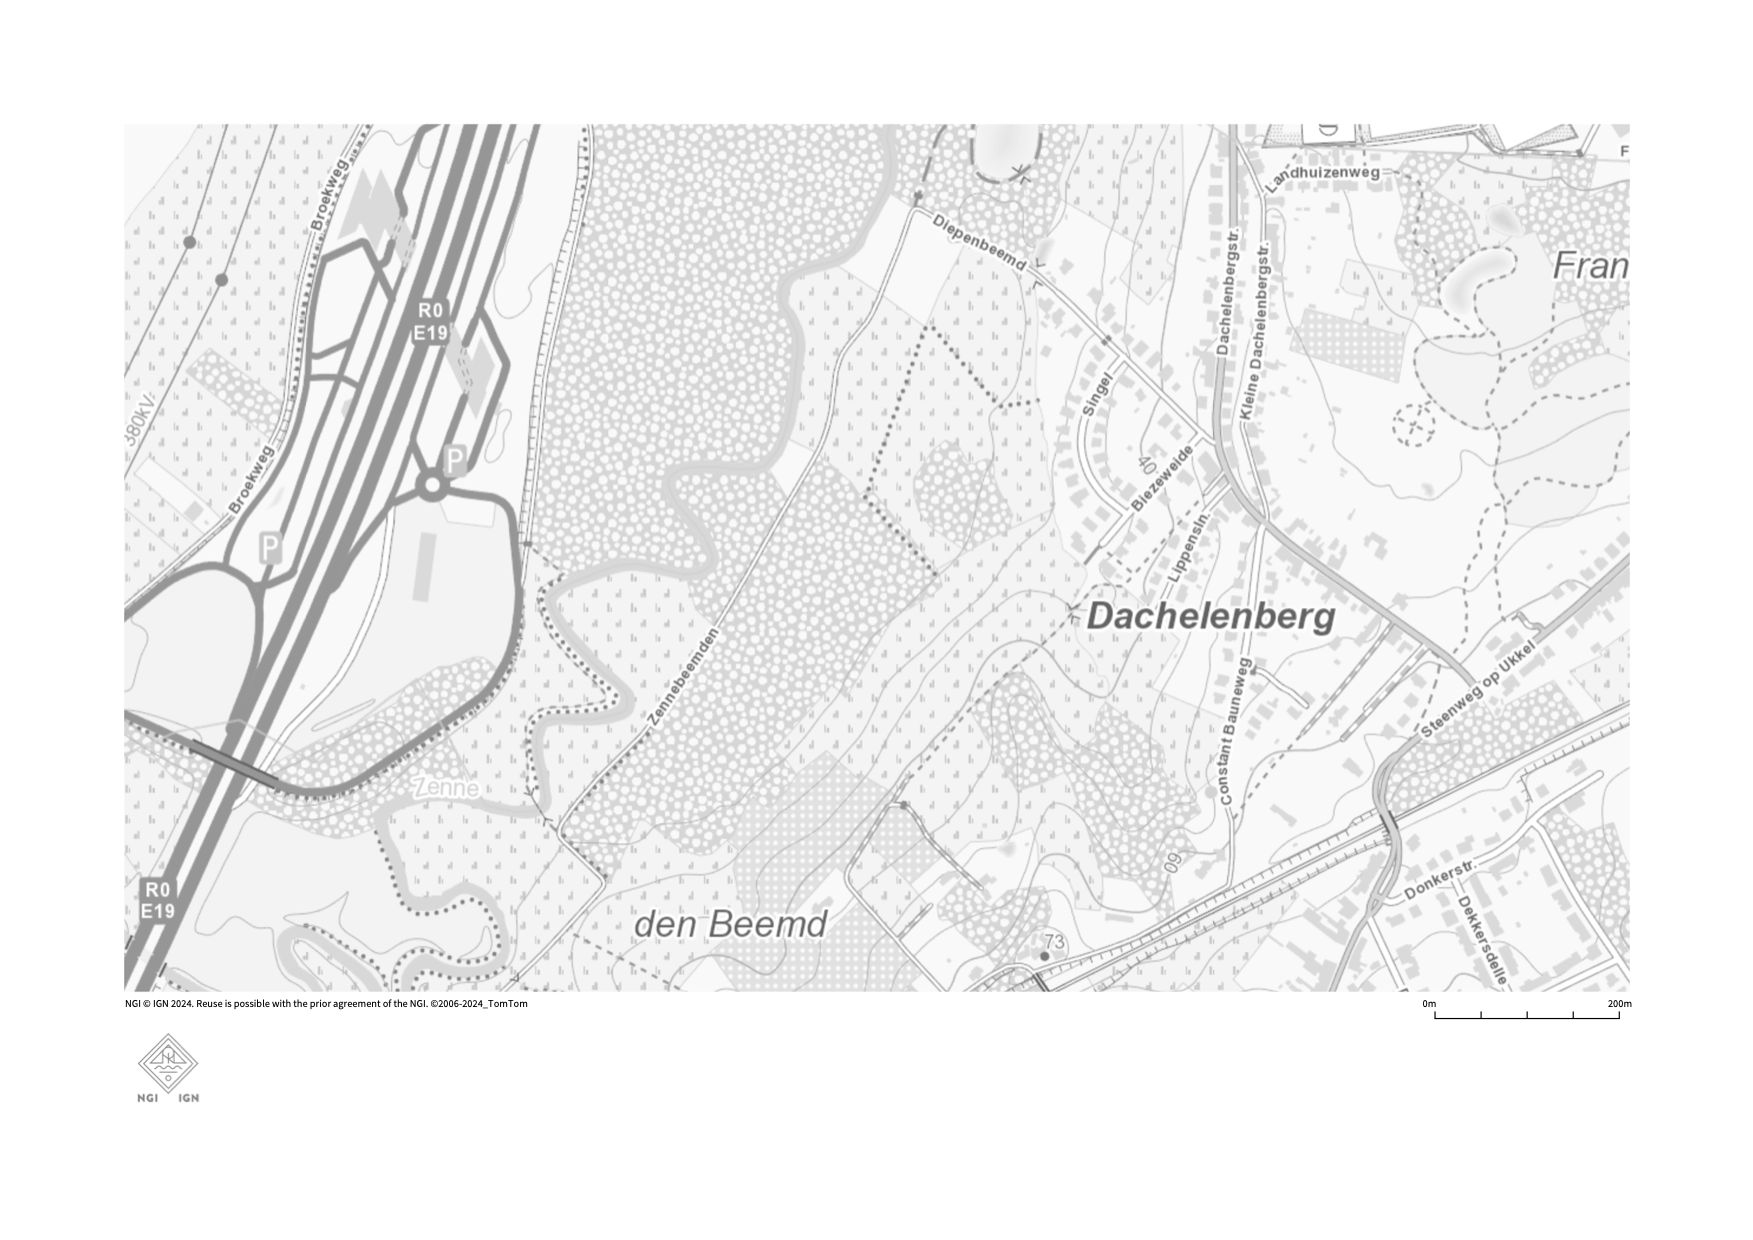
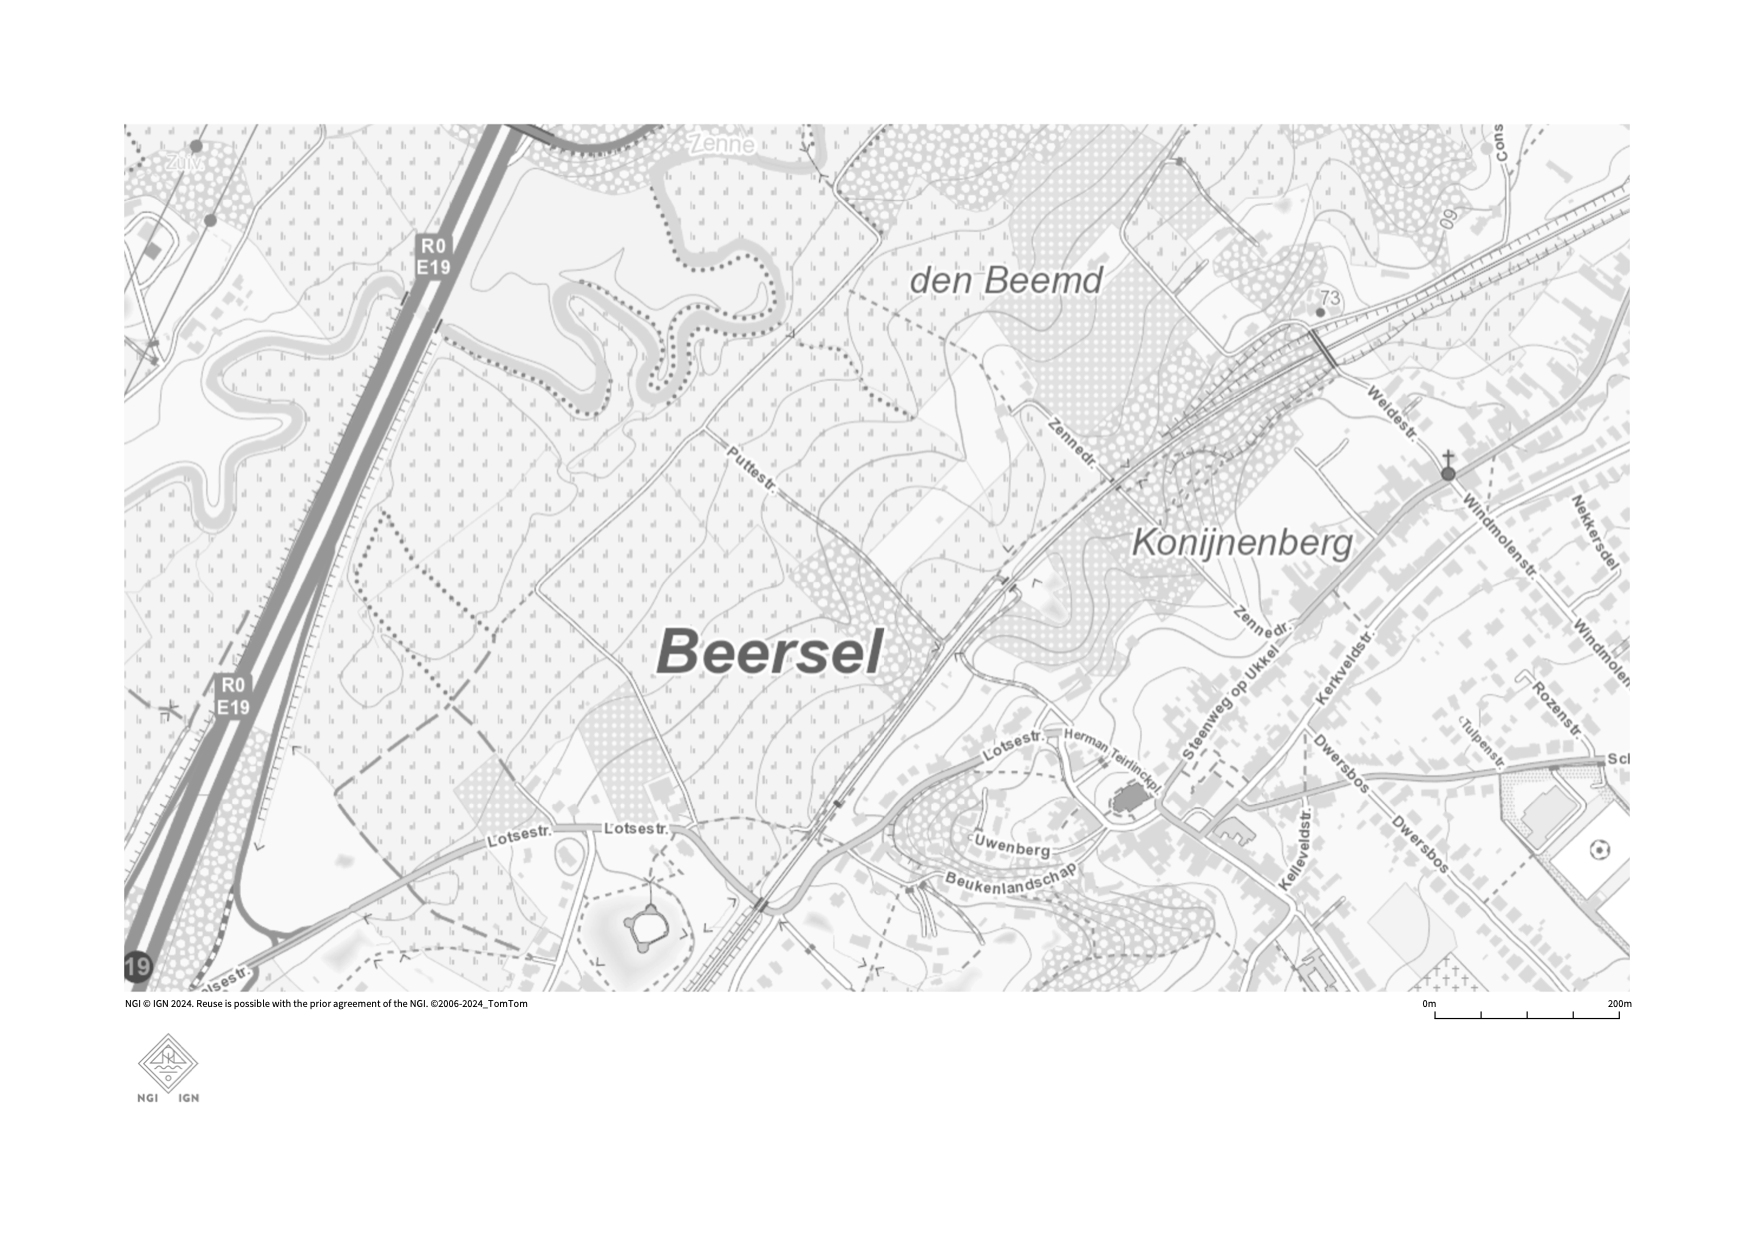
Once the photos were processed and selected by including only every third picture taken, field mapping could start. Belgium’s Nationaal Geografisch Instituut (NGI) publishes an app called TopomapViewer, in which users can print grayscale topographic maps of a selected region. The study area was divided in half, allowing coverage using two A4 sheets of paper. These printed maps were then annotated with the observations from the second visit.